Having a deep understanding of your target audience is the first step to achieving your organization’s goals successfully. Whether your event is targeting consumers from a specific demographic or professionals from specific fields, having the right data at your disposal can be crucial to the success of your event. Here are three ways you could use attendee data and how you can gather it.
Give prospects a taste of the event
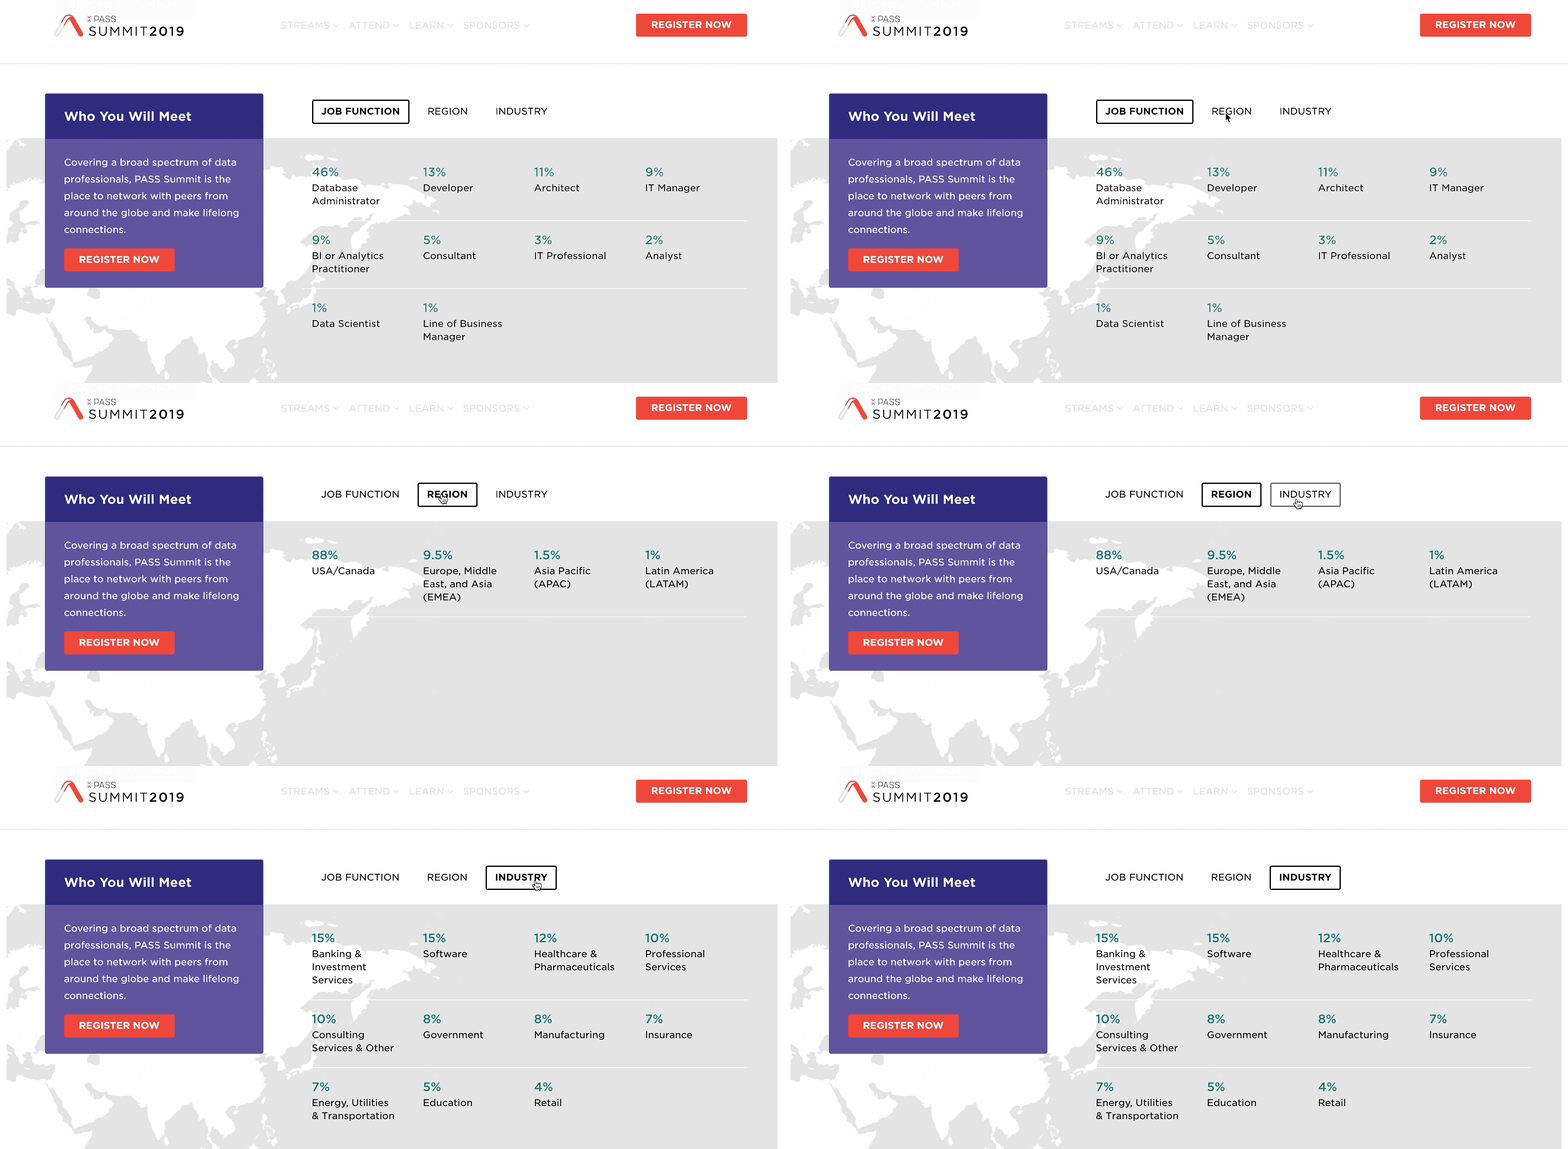
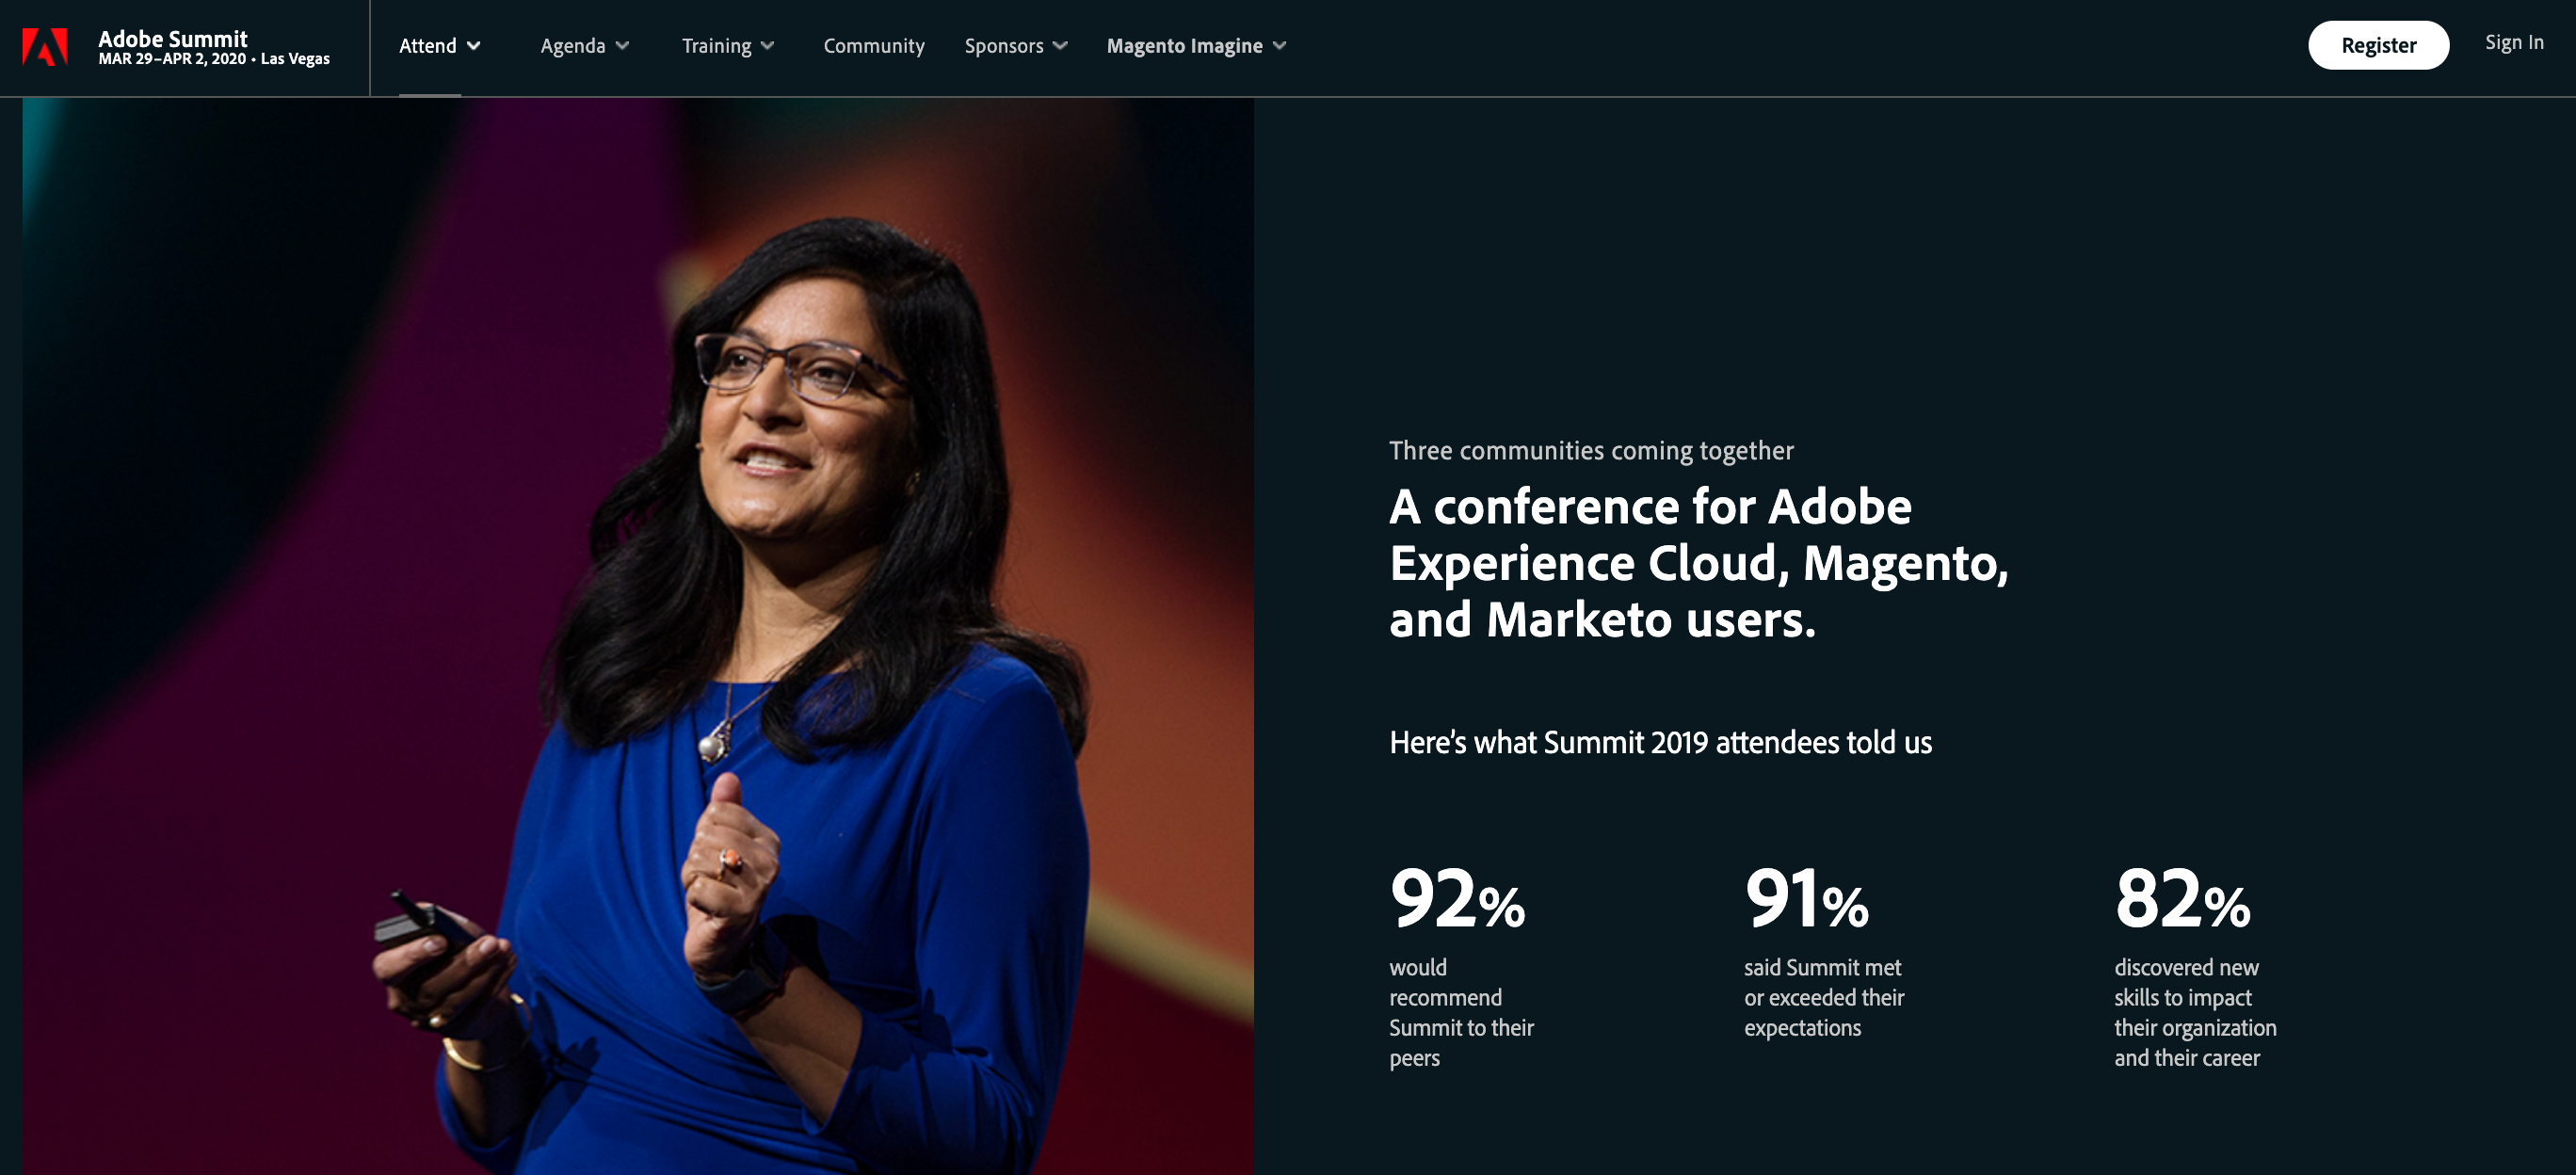
Show prospects what they can expect from the event by showing data from previous ones. That can include demographic information, such as geographic regions attendees are from, age, job titles, industries they work for, and more. You can also share general event stats, such as how many people have attended the event in the past. This will not only give a glimpse of what to expect from the event and who to expect to meet, but it can also create FOMO (fear of missing out), which can be a ticket sale booster for your event. Here is an example of how Pass Summit shares attendee data from previous events on their registration website, and Adobe shares survey data as social proof of attendee satisfaction. You can view other best practices for event websites in this article.
Personalized marketing messages
Once you are able to identify specific groups, you can better target them when promoting your event. Whether you are using remarketing banners or sending email blasts, you will be able to craft personalized messages for each segment you create. Think of the benefits of attending the event based on each segment’s needs to create impactful messages and winning campaigns. When sending emails, remember to follow the privacy policies in place, such as GDPR in Europe and CASL in Canada.
Measure results
We can’t talk about data without talking about analytics and results. Without data, it’s impossible to gauge results properly. If you want to know if you hit your goals, you will need to have specific KPIs to measure. Plan this before the event and check the data after to see how you did. Here are some KPIs you should consider for track for your next event:
- Total number of attendees
- Total revenue generated
- Sponsor dollars
- Most sought-after sessions
How to collect attendee data
Now you know what to do with the data you collect, but how do you collect it in the first place? Glad you asked! You can collect attendee information from registration and survey forms. Then, all you need is a visualization tool to put all the data into easy-to-read charts so you can better read what the numbers have to tell you.
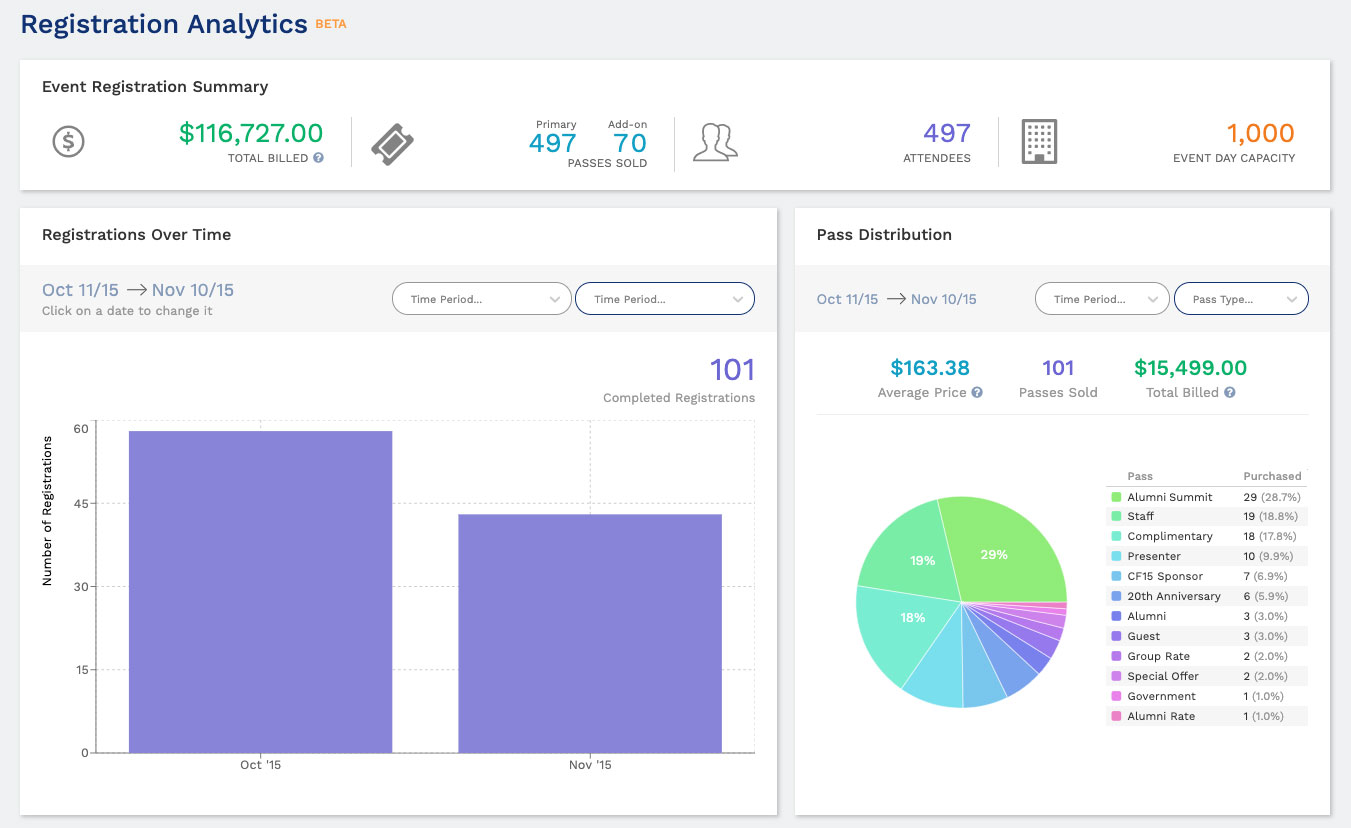
We are excited to announce we are expanding the analytics capabilities in the Attendease event management platform so that you can better gauge your event data and make informed decisions. The new Registration Analytics screen includes 5 panels that display:
- A summary of key event registration metrics
- Registrations over time
- Pass distribution
- Group distribution
- Pass purchases over time
The Form Answers Analytics screen includes a panel for each field from your event registration form(s) and displays the percentage of registrants who responded with each option.
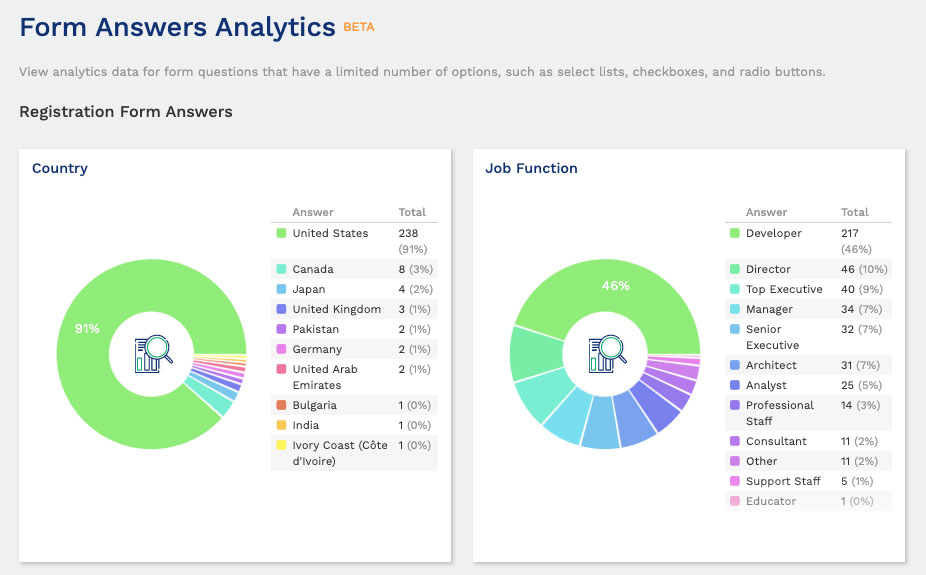
The new analytics dashboard is in Beta, and we will continue to add new categories and functionality with future releases as we expand upon this module. Want to see how it works? Get a personalized demo to go over the Attendease platform and see how you can manage your events more efficiently.
