How to Measure Event Success: A Guide to Event Reporting & Analytics

  • Event Management

Nothing beats the feeling of hosting an event that went off without a hitch—especially since planning, coordinating, and managing a successful event takes a lot of hard work, education, and resources.

However, when the doors are closed or attendees log off, there’s still work to be done. It’s important to evaluate the event, analyze event metrics, and collect the data necessary to make improvements to and decisions about future events. Whether you’re organizing a conference, hosting a small community gathering, or coordinating a virtual town hall, the right event reporting and analytics software will help you measure the success of your event.

The Importance of Event Reporting

Creating event reports, tracking event metrics, and analyzing the results are all essential to event planning and management.

By measuring the success of an event, event organizers can use data to learn from their experience, spot trends and patterns, set realistic goals based on past event performance, and gain deeper insights into how attendees engage with their events.

Event reports also provide event planners with a variety of other benefits:

Evaluate Event Performance

Tracking event metrics and analyzing event data can determine whether your event achieved its goals as well as help establish objectives for future events.

Learn What’s Working (& What’s Not)

During an event, you can track metrics like attendance, participation levels, complaints, social media reach, and average spending to get an idea of what is working—and what needs to be improved.

Demonstrate the Value of the Event

After the event, who are you reporting to: your boss, clients, investors, or other stakeholders? With event reporting data analytics, you can show the tangible benefits of the event and calculate their return on investment (ROI).

Improve Attendee Experience

Reporting, data collection, and analysis gives you the opportunity to get feedback from attendees. With this valuable data, you can enhance and refine the attendee experience and improve future events.

16 Key Event Metrics to Report & Analyze

Every event is different, and the metrics you track to measure success will depend on the specifics of the event.

However, consider collecting both quantitative and qualitative metrics. Quantitative metrics like attendance and revenue as well as qualitative metrics like attendee satisfaction and engagement levels are both essential parts of evaluating the success of an event.

Here are a few of the most common event metrics that event organizers use to create reports, analyze data, and evaluate event performance.

1. Number of Registrants or Tickets Purchased

The number of registrants or tickets purchased represents the number of individuals who signed up to attend the event.

2. Total Attendance

Total attendance is a vitally important metric that tracks the number of people who checked-in at the event. This number should include both in-person and virtual attendees, if relevant.

3. Registrant Conversion Rate

It’s not uncommon for some registrants to miss the event. The registrant conversion rate is the percentage of people who registered and actually attended the event.

4. Attendee Demographics

Depending on your event management software, you may be able to analyze attendee demographic metrics such as age, gender, location, industry, and more to get a deeper understanding of your audience.

5. Gross Revenue

Gross revenue, also called total revenue, captures the revenue earned from the event, including ticket sales, sponsorships, merchandise, and other event revenue streams. This metric does not take into account how much money was spent on the event—just the revenue gained.

6. Return on Investment (ROI)

Event ROI is the net revenue, calculated by deducting overhead costs from the gross revenue. This net figure represents the actual financial performance of the event.

7. Budget Variance

How much did you budget for the event? How much did you end up spending? Budget variance measures the difference between these two numbers to evaluate financial planning and management.

8. Cost per Attendee

You can also calculate the cost per attendee to understand the average expenses related to each event participant.

9. Social Media Engagement & Reach

Social media metrics measure the engagement and reach of the event on social media. Data could include likes, shares, comments, hashtag use, followers, hits, and more to see how many people saw and interacted with the event across social platforms.

10. Website Traffic

Do you have an event website? Or an event page on another website? Track website traffic before, during, and after the event to measure audience interest and engagement.

11. Mobile App Downloads & Activity

If the event has a mobile event app, you can monitor the number of app downloads as well as user activity to get a better idea of attendee engagement.

12. Engagement & Participation Levels

Tracking participation and engagement levels identifies the parts of the event that resonated the most with attendees and helps determine areas they didn’t like. Focus on an individual session or workshop or take a big picture view to get more insights.

13. Number of Complaints & Issues Logged

What problems were reported during the event, either on-site or online? Were there any recurring issues you need to address before your next event? This data helps identify areas of concern.

14. Leads Generated

For networking or sales events like trade shows, product launches, conferences, and fundraisers, getting new leads is vitally important. Track the number and quality of leads or contacts collected throughout the event.

15. Attendee Satisfaction

With surveys, polls, quizzes, and interviews, you can measure attendee satisfaction. Use open-ended questions to gather qualitative feedback and standardized rating scales to get qualitative scores. This data provides a deeper understanding of audience satisfaction.

16. Product Sales

Successful events tend to lead to improved brand recognition—which should impact sales. Track post-event product sales to see if there is a spike directly after the event.

EventUp Planner: Track, Measure, & Analyze Events with Ease

Looking for an event planning partner? We’re here to help.

EventUp Planner is comprehensive event management and reporting software for event planners, organizers, and managers that is designed to streamline the entire events journey. With a range of event reporting features, support for hybrid, virtual, and in-person events, and a customizable interface, EventUp Planner is ready to help you plan and manage all your events in one intuitive platform.

Book a free call with our team today to learn more about how EventUp Planner’s complete event management and reporting software platform can transform your event experience.

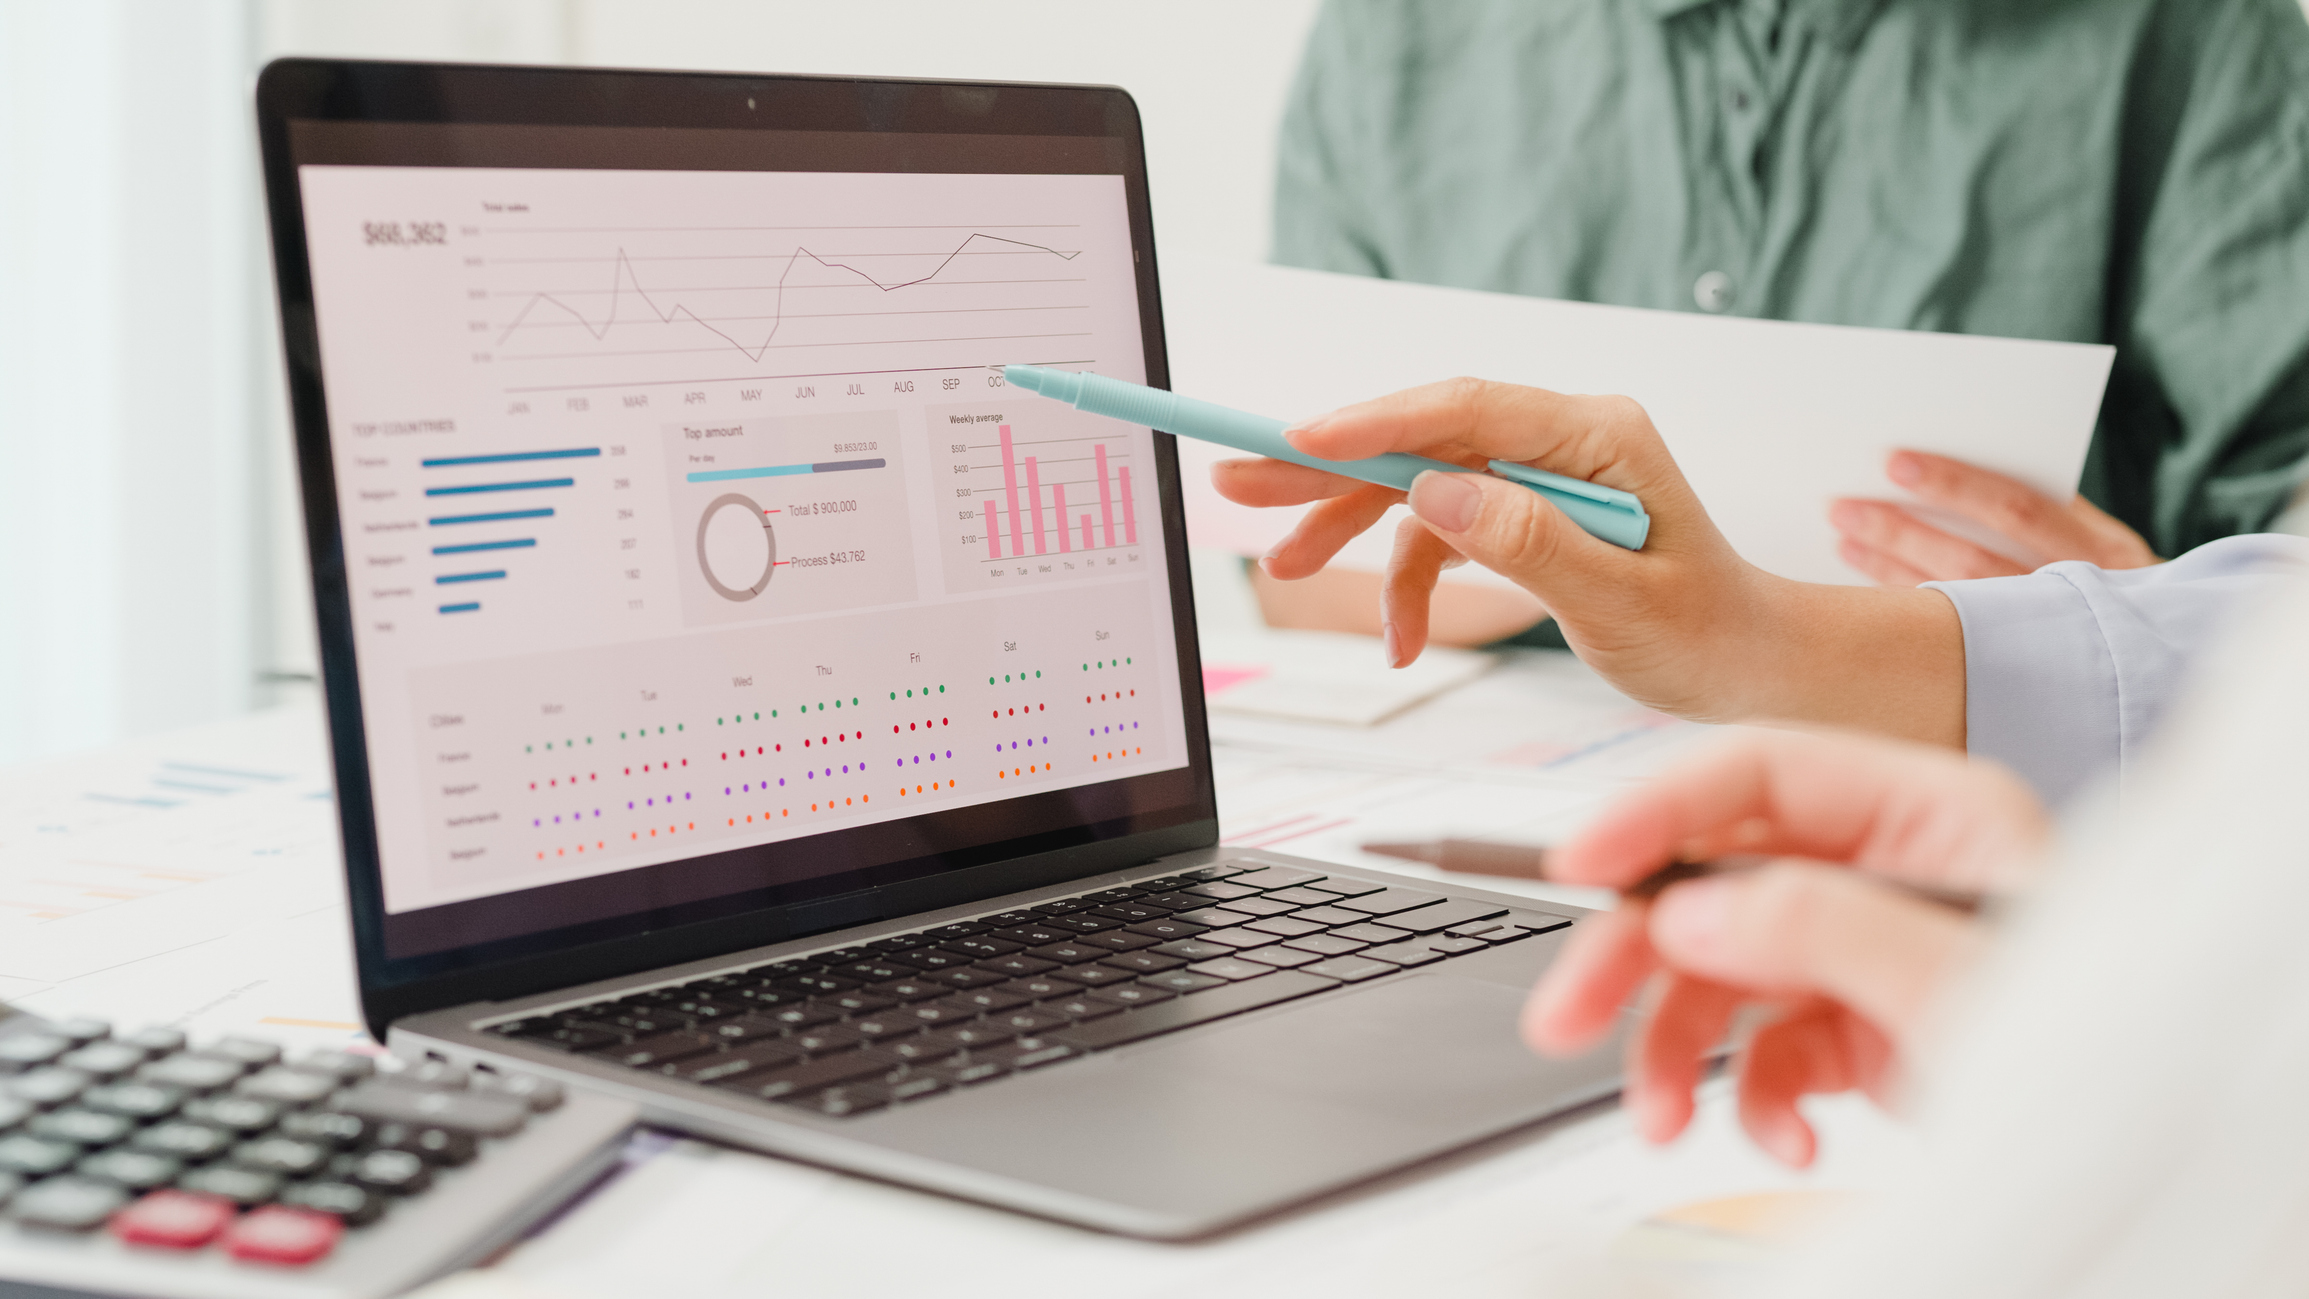
 

Analyzing Event Success Metrics: Part 2

  • Event Management News
How to Analyze Event Success Metrics: Part 2 Blog Banner

In the first part of our guide about event website analytics, we uncovered how you can shine a light on an event’s success online using some essential event success metrics. This guide aimed to set the groundwork for navigating the world of event analytics, introducing the vast world of website analytics and their instrumental role.

In this sequel, we’ll go deeper, discussing more advanced event success metrics that can refine, redefine, and ultimately elevate your event strategies. The better your strategies, the more attendees will be at your event!

As we turn the page to this next chapter, get ready for even more insights and tools to supercharge your event’s digital presence. Are you ready for round two? Let’s go!

Understanding the impact of social media

Launching and maintaining a social media campaign is great, but when it comes to measuring the success of an event at-large, it’s only the beginning. Taking the time to understand the impact of your social media efforts is crucial when reviewing event success metrics.

Your social media presence is often the starting point of the customer journey, so it’s essential to know how your efforts are performing.

Begin by identifying where your audience is discovering your event website. Once you’ve identified your traffic sources, dig deeper. Analyze which platform is not only generating more engagement but also converting visitors into registered attendees. For example, do you see more engagement and event attendee conversions on LinkedIn than on Instagram? Using this knowledge allows you to make data-driven decisions and direct your efforts towards the platform that yields the best results.

If you wish to go deeper still, consider the timing. Are there specific days or hours when your social media posts are driving more people to your website? With this insight, you can optimize your posting schedule—ensuring your content reaches the right audience at the right time!

Essential email marketing metrics

Unlike traditional mass marketing, which casts a wide net to reach a broad audience, direct marketing focuses on reaching individuals or a well-defined group of potential customers.

Email campaigns are a vital component of a direct marketing strategy, but simply sending emails alone isn’t enough—your emails need to resonate with and drive action from your audience. For them to be successful, you must measure their effectiveness using two key event success metrics: open rate and click-through rate.

The open rate is simple in concept. It tells you how many people are opening your emails once they reach their inbox. The success of your email campaign can easily be measured by whether your prospective attendees are opening your event email blasts or simply hitting “delete”.

Next, delve into the click-through rate. This metric tells you whether readers are not only opening your emails but also taking action within—via clicking on the links embedded within the email’s body. The higher the click-through rate, the better!

By understanding which elements of your email content are working, you can refine your messaging strategy and allocate resources more effectively.

Measuring your offline event marketing efforts via direct URLs

Many event marketing strategies are still carried offline through posters, print ads, or mail. While these strategies can be incredibly effective, they often can’t be measured nearly as precisely as online efforts. However, there still is a way to ballpark if they are successful using event website analytics.

Here, you’ll want to focus on the number or percentage of visits directly to your event website URL. These metrics reveal the individuals who navigate straight to your event page—meaning they didn’t use Google, an email, or social media to get to your event website. If you see a spike in direct traffic shortly after you’ve deployed an offline direct marketing campaign, that could be a sign it’s working!

Leveraging influencer marketing and referrals

Referral marketing is based on the idea that people trust recommendations from those they know and respect. It is a strategy that relies on existing customers or advocates to recommend a product, service, or brand to their friends, family, or social connections.

Influencer marketing, while related to referral marketing, instead involves partnering with individuals or personalities who have a significant and engaged following on social media or other platforms. Brands collaborate with influencers who align with their target audience and brand values, and in return the influencers promote products or services through their own content.

Both strategies can be a game-changer when it comes to boosting event registration numbers and strengthening partnerships with speakers, sponsors, or exhibitors. If you’re considering a referral or influencer marketing campaign to enhance your event attendance, it is recommended to quantify how many registrants are discovering your event through associated affiliations and referral links.

To track these referrals effectively, you’ll need to create unique tracking codes or links for each source or partner. You can even include promo codes to give your referral’s audience an incentive to attend your event. Within your event website analytics, all these codes allow you to precisely measure the impact of each referral source—making it easier to optimize your event marketing efforts and gauge the success of this type of campaign.

Supplementing your website’s backend with Google Analytics

While your event website analytics can provide a wealth of valuable data, Google Analytics offers even more information to help you optimize your strategies.

This includes:

  • Bounce Rate, which reveals the percentage of visitors who leave your site without exploring further. A high bounce rate may indicate issues with your landing page or content that need addressing.
  • Session Duration, which shows how long visitors stay on your site. Longer durations suggest engagement, while shorter ones may indicate that your content needs to be more captivating.
  • Pageviews, which is how many pages your visitors view. This helps identify which content or sections are drawing the most attention.
  • Session Path, which is how visitors navigate your site and the sequence of pages they visit. This insight helps you optimize the user experience and content flow.
  • Exit Pages, which is when and where people leave your event website. This allows you to pinpoint potential drop-off points and refine those pages to retain more visitors.
  • Popular Pages, which tells you which pages are most popular amongst your audience.

Using Google Analytics alongside your event website’s built-in analytics creates a comprehensive suite of event success metrics. Together, they can give you an even more in-depth look at the results of your event marketing efforts!

Summary of event success metrics

Measuring event success with analytics is the key to refining and optimizing your event strategies. By delving into advanced metrics, you can elevate your events to new heights!

But why stop there? To take your event success measurement to the next level, consider Attendease. Our powerful event software is designed to deliver awe-inspiring event experience and comprehensively measure every aspect of your event’s performance:

  • Amplify and simplify your event marketing with integrated marketing tools
  • Track performance throughout an entire event lifecycle
  • Gather web traffic data from our Google Analytics integration

How to Measure Event Success with Analytics: Part 1

  • Event Management
The Must Implement Analytics For Your Event Website: Part 1

There are a lot of ways to measure event success. That’s why we’re breaking down the steps into two parts. In this first segment of our two-part series, we’ll unravel the magic of analytics. We’ll explore the behind-the-scenes data of your website, uncovering invaluable insights to enhance its performance. By the end, you’ll have clarity on how your event website fares, where you can boost its impact, and how to measure event success as a result.

Publishing an event website is a major stepping stone in putting on a great event. But learning whether your website is doing what it’s supposed to can appear challenging at first. If only you had a tool that shows you exactly how visitors interact with your site—where they come from, which parts they love, and where they might lose interest—to aid you in your event planning journey.

You’re in luck: website analytics do exactly that! They tell real truths about your audience’s journey and your event’s reach. Whether it’s a small tweak today or a seismic strategy shift for the future, you can learn how to measure event success and make tangible improvements to your event marketing by taking the time to understand website analytics.

Let’s get started and make your event truly stand out!

Uncovering where your traffic is coming from

Understanding the sources that drive visitors to your event registration website is key. Every online platform—whether it’s Google, social media, or something else entirely—can usher potential attendees towards your event. Knowing where your audience comes from is crucial for smart marketing.

When you pinpoint platforms that consistently steer traffic to your event website, doubling down on them becomes a no-brainer. Spending time on a platform that converts to website visitors helps bring more awareness to your event. For example: if you notice a significant chunk of your website visitors come from Instagram, it’d be wise to invest more time in posting, building your followers, and engaging with them on that platform!

Learning how to measure event success from social media is easy. Simply check the referral traffic on your event website’s analytics dashboard. Your dashboard will show you which social platforms are driving the most visitors to your site and which are missing the mark. By analyzing this data, you can determine which channels are most effective for your event promotion and adjust your social media strategy to maximize engagement and registrations.

The power of organic search

Ever wondered how attendees stumble upon your event website when they type related industry terms into a search engine? That’s the magic of organic search! However, it’s not actually magic at all—in fact, the position your site holds in these search results is heavily influenced by how well you’ve tailored your site for SEO and the overall buzz it’s generating.

While the algorithms for organic searches constantly adapt, having relevant content and a strong presence in social media discussions can boost your standings. To get a grasp on how much traffic comes this way, keep an eye on the ‘organic search’ metric. This will show you what portion of your site’s visitors found you organically.

When your event website pops up at the top of organic search results for key terms that resonate with your brand, give yourself a pat on the back: that’s a clear sign you’ve nailed your site optimization and social media outreach!

However, if you’re not making a mark as you’d hoped, it’s time to re-evaluate the language you’re using. Does it truly echo your brand? How active and engaging are your interactions on platforms like Facebook, Instagram, and LinkedIn? Making sure your content aligns with your brand and maximizing your social media presence can make all the difference, so don’t be afraid to dive in and tweak what you need. You may be a few small details away from watching your online visibility soar!

Getting the most out of paid search

Investing in ads on platforms like Google, LinkedIn, X (FKA Twitter), or Facebook can certainly help you cast a wider net when it comes to audience reach. However, simply opening your wallet doesn’t guarantee results—getting the most out of paid ads takes a measured approach and just as much care as any other marketing strategy.

To supercharge the effectiveness of your ads, make sure you tailor them to align with the characteristics of your natural audience. Finding your natural audience involves identifying and connecting with individuals who inherently resonate with your brand’s values, offerings, and message. By seeking out those who are instinctively inclined to engage with and advocate for your brand, you can ensure a more genuine and lasting relationship.

Any marketing expert will know that ads can often take time to be effective. However, monitoring the metric that counts the number of visits or the percentage of total visits resulting directly from your ads is a sure-fire way to assess if this strategy aligns with your goals and your budget. If the results aren’t what you expect, it’s likely time to refine your ad’s targeting specifics.

The importance of tracking link performance

At its core, link performance measures the effectiveness of individual links you or someone else have placed across various online platforms. These links could be strategically placed in articles, directories, email campaigns, social media posts, or other online spaces where potential attendees might encounter them.

It’s crucial to track the performance of links to your event page—doing so gives a clear picture of where your visitors are discovering your event from, tells you exactly how much traffic your links are bringing you and whether it’s important to seek more link placements in the future.

While the primary goal of tracking link performance is to optimize promotional efforts, a secondary, often overlooked benefit is enhancing user experience. By taking time to understand the journey a user takes to reach your event website, you can tailor their experience accordingly.

Summary

From understanding where traffic originates, be it social media or organic searches, to the potency of paid ads and the significance of tracking link performance, analytics are the answer to how to measure event success from your event website. Knowing which platforms direct visitors, or how SEO influences organic search results, is crucial for effective marketing!

Stay tuned for Part 2, where we’ll explore some typical event marketing activities and how you can derive useful performance data from each of them.

Looking for software that makes event website analytics a breeze?

With Attendease, you can create agency-grade event websites with the easy-to-use Website Builder and easily measure event success:

  • Compare against your own benchmarks
  • Gain insight on what’s working and drive improvement
  • Integrate your Attendease event website with Google Analytics, for timely web traffic insights